Percona Monitoring and Management 3.5.0
Release date: November 15th 2025 Percona Monitoring and Management (PMM) is an open source database monitoring, management, and observability solution for MySQL, PostgreSQL, and MongoDB. PMM empowers you to:
- monitor the health and performance of your database systems
- identify patterns and trends in database behavior
- diagnose and resolve issues faster with actionable insights
- manage databases across on-premises, cloud, and hybrid environments
Release summary
Release highlights
MongoDB dashboard improvements
We’ve made several enhancements to improve MongoDB monitoring:
- Renamed Query Execution Times panel to Operation Latencies in Router Summary, Sharded Cluster Summary, and Replica Set Summary dashboards for clarity
- Fixed duplicate service counts in MongoDB dashboards and node filtering issues in Replica Set Summary, Cluster Summary, and Router Summary dashboards
-
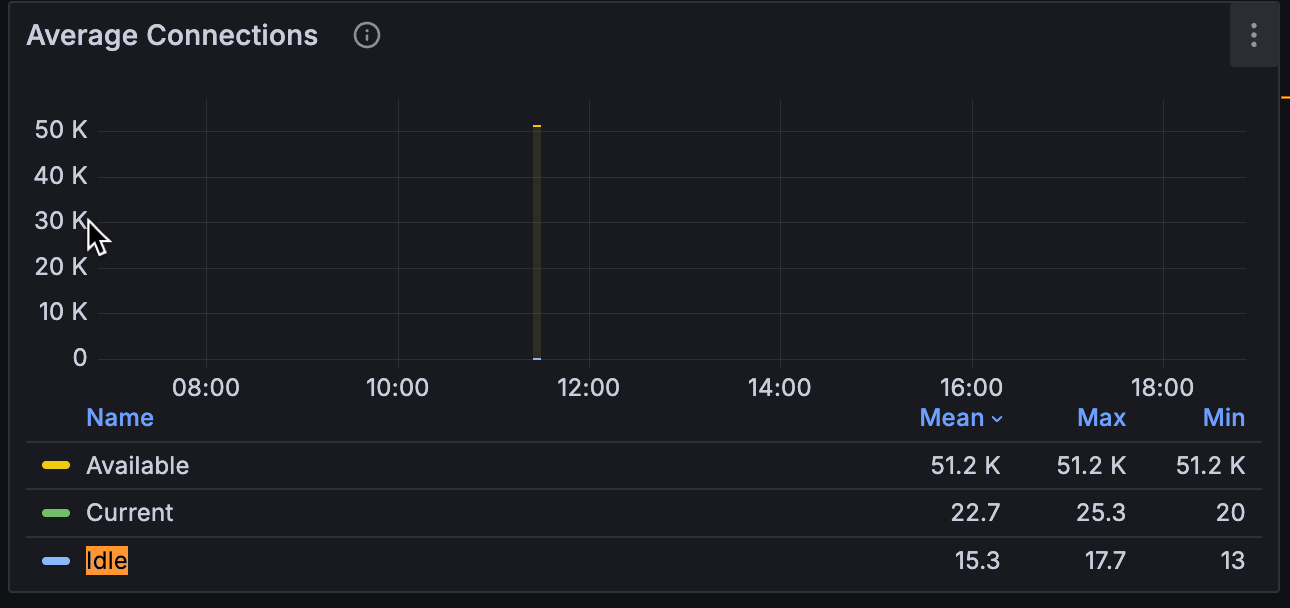
Added idle connections metric to the Connections panel in Cluster Summary and Replica Set Summary dashboards to help identify performance issues:
Components upgrade
Improvements
- PMM-14108: Added idle connections metric to the Connections panel available in MongoDB Cluster Summary and Replica Set Summary dashboards. Idle connections are now displayed alongside Available and Current connections to help identify potential performance issues.
- PMM-14107: Renamed the Query Execution Times panel to Operation Latencies in MongoDB Router Summary, Sharded Cluster Summary, and Replica Set Summary dashboards to better reflect the actual metrics being displayed.
Fixed issues
- PMM-14022: Fixed duplicate service counts in MongoDB dashboards and the MongoDB down alert rule on the Alert rules page caused by high-resolution and low-resolution exporter jobs being counted separately.
- PMM-14106: Fixed MongoDB Command Operations and Collection Details panels in Replica Set Summary, Cluster Summary, and Router Summary dashboards to correctly apply the node filter selection. The panels now display data only for the selected node instead of always showing all nodes.